SPECviewperf™ is a portable OpenGL performance benchmark program written in C. It was developed by IBM. Later updates and significant contributions were made by SGI, Digital and other SPECopcSM project group members. SPECviewperf provides a vast amount of flexibility in benchmarking OpenGL performance. Currently, the program runs on most implementations of UNIX, Windows NT, Windows 95/98 and Linux.
Higher numbers equate to better performance.
SPECviewperf is a professional 3D CAD based benchmark. The beauty of this program is, there's no special optimization written for the CPU's, it's mainly a FPU benchmark for the processor. However it still does stress the "whole" system because it does puts a lot of load on the Northbridge and how it interacts with the AGP/Videocard. The results here are quite good for an Athlon XP.
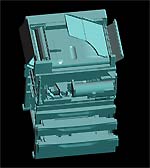
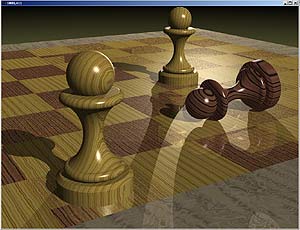
The Persistence of Vision Ray Tracer (POV-Ray) is an all round excellent package, but there are two things that particularly make it stand out above the rest of the crowd. Firstly, it's free, and secondly, the source is distributed so you can compile it on virtually any platform.
Lower numbers denote faster calculation times (seconds), and hence, better performance.
| POVRay Benchmark Results |
|
Processor |
seconds |
Ranking |
| 1. |
1.6 GHz |
198 sec |
 |
| 2. |
1.8 GHz |
179 sec |
 |
The benchmark results listed above are for rendering a single image of the pawns wire frame at 1024x768 resolution (AA0.3). POVRay is a professional 3d rendering benchmark which again puts the AthlonXP in a good light. It's all FPU here, and the AthlonXP has a lot of it!
WinBench 99 is a subsystem-level benchmark that measures the performance of a PC's graphics, disk, and video subsystems in a Windows environment. WinBench 99's tests can run on Windows 95, Windows 98, Windows NT, Windows 2000, and Windows Me systems.
| WinBench 99 v1.2 Benchmark Results |
|
AthlonXP 1900+ |
Score |
Ranking |
| 1. |
Business Disk - 1.6 GHz |
8950 |
|
| 1a. |
Business Disk - 1.8 GHz |
8510 |
|
|
|
|
|
| 2. |
High-End Disk - 1.6 GHz |
27300 |
|
| 2a. |
High-End Disk - 1.8 GHz |
24700 |
|
|
|
|
|
| 3. |
Business Graphics - 1.6 GHz |
770 |
|
| 3a. |
Business Graphics - 1.8 GHz |
830 |
|
|
|
|
|
| 4. |
High-End Graphics - 1.6 GHz |
1580 |
|
| 4a. |
High-End Graphics - 1.8 GHz |
1790 |
|
WinBench 99 is similar to that of Sysmark 2001 in that is uses a series of scripted programs to accomplish its testing - overclocking here doesn't seem to help things very much, in fact, some things run slower probably because the PCI bus is running faster then it's supposed to.
 Winstone 2001
 |
Source: Zdnet |
|
Content Creation Winstone 2001 keeps multiple applications open at once and switches among those applications. Content Creation Winstone 2001's activities focus on what we call "hot spots," periods of activity that make your PC really work--the times where you're likely to see an hourglass or a progress bar.
Business Winstone is a system-level, application-based benchmark that measures a PC's overall performance when running today's Windows-based 32-bit applications on Windows 98 ME, Windows NT 4.0 (SP6 or later), Windows 2000, Windows Me, or Windows XP which runs real applications through a series of scripted activities and uses the time
a PC takes to complete those activities to produce its performance scores.
Again, as we can see, the AthlonXP architecture is very scaleable. This time, Content Creation increases 10%, that's huge considering this is usually the time you sit waiting for your computer to spit out the information, while Business Winstone jumps a whooping 18%!